C# Development with VS Code — Part 3: Debugging
Series Overview
- Getting Started — Installation, UI tour, Git integration
- Developing C# Apps — Extensions, editing, IntelliSense, NuGet
- Debugging (this article) — Breakpoints, configurations, web app debugging, attach to process
- Productivity — Keyboard shortcuts, tasks, workflow optimisation
Setup
Debugging in VS Code requires the C# Dev Kit extension (see Part 2) and a .vscode directory with debug assets.
When you first open a C# project, VS Code prompts you to generate these assets:
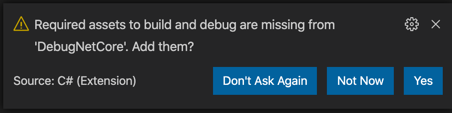
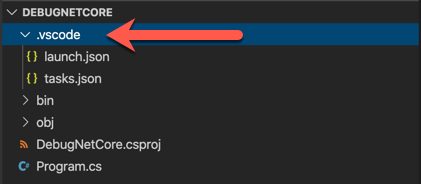
Click Yes to create the .vscode directory:
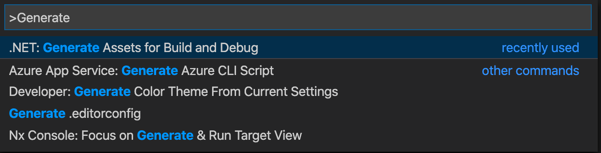
If you missed the prompt, use the Command Palette (Ctrl+Shift+P) and search for .NET: Generate Assets for Build and Debug:
The Debug Pane
Open the Debug pane with Ctrl+Shift+D / Cmd+Shift+D:

At the top is a dropdown with configurations:
- .NET Core Launch (console) — builds and runs your app with the debugger attached
- .NET Core Attach — attaches the debugger to an already-running process
Catching Exceptions
Click the green Run button to start debugging. If your code throws an unhandled exception, the debugger pauses on the exact line:
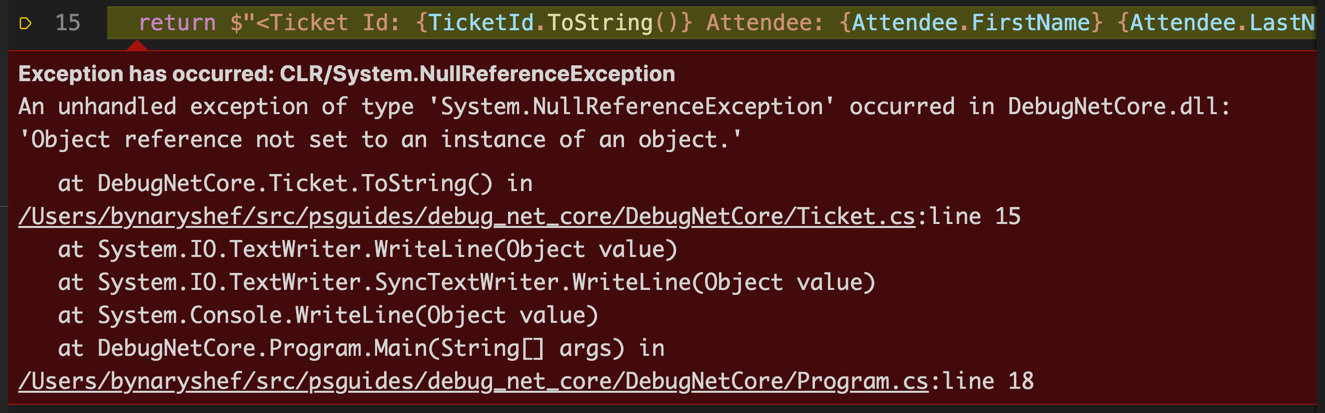
The VARIABLES section in the Debug pane lets you inspect the state of all objects:
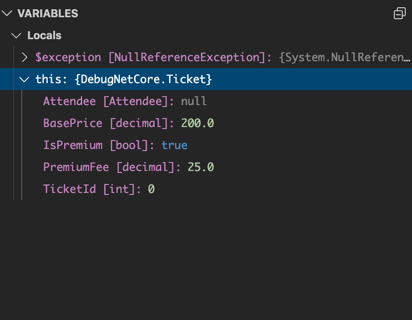
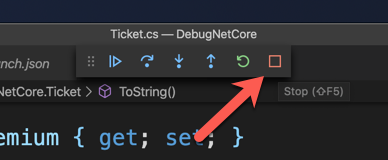
In this example, expanding the Ticket object reveals that Attendee is null — the cause of the NullReferenceException. Stop the debugger with the Stop button:
Breakpoints
Breakpoints pause execution at a specific line — no exception needed. Click to the left of any line number to set one (a red circle appears):
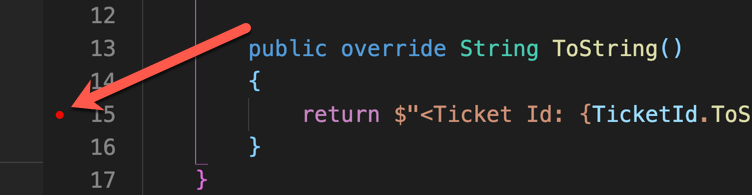
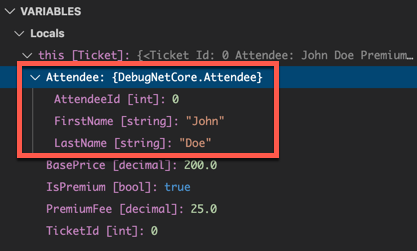
Run the app. Execution pauses at the breakpoint and you can inspect all variables:
Inline Variable Inspection
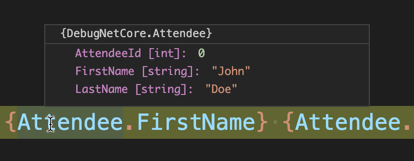
Hover over any variable in the editor while paused to see its current value — no need to look at the Debug pane:
Continuing Execution
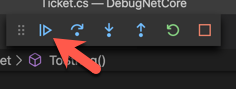
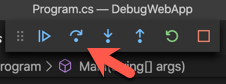
Click Continue (F5) to resume execution until the next breakpoint or the end of the program:
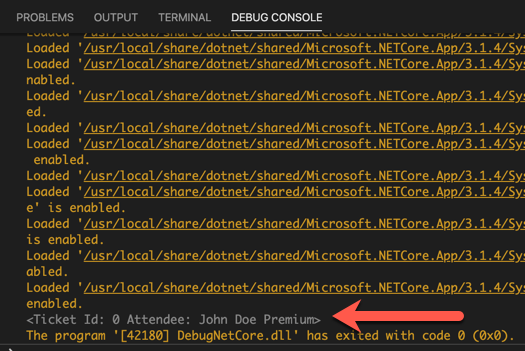
Output appears in the Debug Console:
Debug Toolbar Actions
| Button | Shortcut | Action |
|---|---|---|
| Continue | F5 | Resume execution |
| Step Over | F10 | Execute current line, skip into methods |
| Step Into | F11 | Execute current line, enter method calls |
| Step Out | Shift+F11 | Finish current method, return to caller |
| Restart | Ctrl+Shift+F5 | Stop and restart debugging |
| Stop | Shift+F5 | Stop debugging |
Debug Configurations
The launch.json file in .vscode defines how the debugger runs your application.
Passing Command-Line Arguments
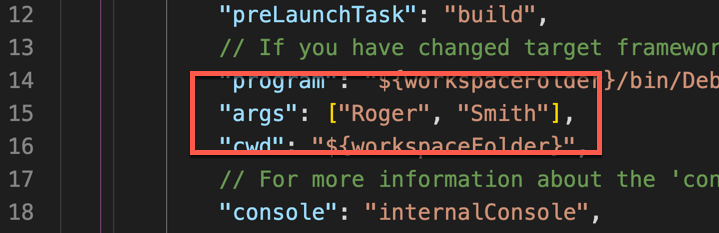
If your app reads from args, you need to pass arguments through the debug configuration. Edit .vscode/launch.json and add values to the args array:
1
2
3
4
5
6
7
8
9
10
{
    "name": ".NET Core Launch (console)",
    "type": "coreclr",
    "request": "launch",
    "program": "${workspaceFolder}/bin/Debug/net10.0/MyApp.dll",
    "args": ["John", "Doe"],
    "cwd": "${workspaceFolder}",
    "stopAtEntry": false,
    "console": "internalConsole"
}
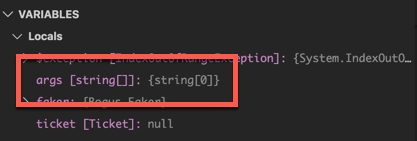
Without this, args is an empty array and accessing args[0] throws an IndexOutOfRangeException:
Environment Variables
Add environment variables to your configuration:
1
2
3
4
5
6
7
{
    "name": ".NET Core Launch (console)",
    "env": {
        "ASPNETCORE_ENVIRONMENT": "Development",
        "MY_API_KEY": "test-key-123"
    }
}
Debugging Web Applications
For ASP.NET Core web apps, the generated configuration automatically handles launching the browser. The first configuration targets web apps instead of console apps.
Debugging Razor Pages
You can set breakpoints in both C# code-behind files (.cshtml.cs) and Razor markup files (.cshtml):
Code-behind breakpoint — step through your OnGet method:
Razor markup breakpoint — inspect variables directly in the template:
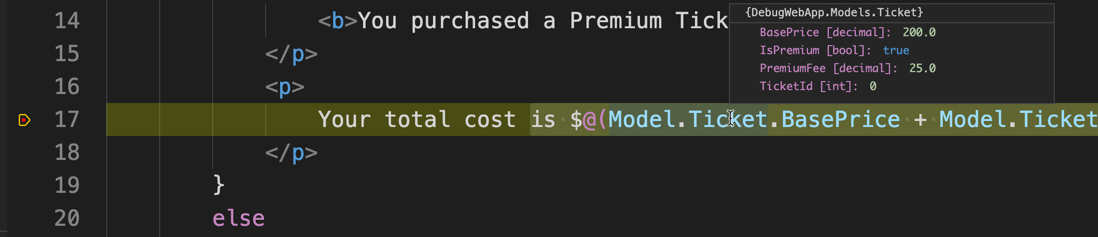
This is powerful — you can debug the Razor template rendering and inspect the values of variables as they’re written to HTML.
Attaching to a Running Process
Sometimes you want to use dotnet watch run for hot-reload during development but still have debugging available. The Attach configuration handles this.
Workflow
- Start your app with
dotnet watch runin the terminal - Select the .NET Core Attach configuration in the Debug pane
- Click Run — VS Code shows a list of processes:
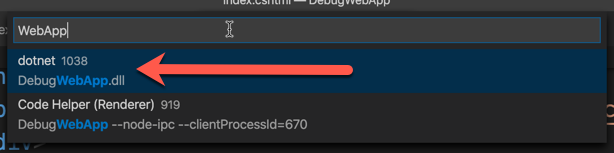
- Search for your project name and select the
dotnetprocess running your.dll
Now you have the debugger and hot-reload working together.
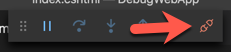
The debug toolbar shows a Disconnect button instead of Stop — clicking it detaches the debugger but leaves the app running:
Debugging Tips
Conditional Breakpoints
Right-click a breakpoint and select Edit Breakpoint. Add a condition like items.Count > 5 — the breakpoint only triggers when the condition is true.
Logpoints
Instead of a breakpoint, add a Logpoint (right-click the gutter > Add Logpoint). It logs a message to the Debug Console without pausing execution — useful for tracing without modifying code.
Watch Expressions
In the WATCH section of the Debug pane, add expressions like user.Username.Length or items.Where(x => x.Status == "Active").Count() to monitor computed values as you step through code.
Debug Console
The Debug Console (Ctrl+Shift+Y) lets you evaluate expressions while paused at a breakpoint. Type any valid C# expression to inspect or compute values on the fly.
Key Takeaways
- Generate debug assets early — accept the prompt or use
.NET: Generate Assets for Build and Debug. - Use breakpoints, not
Console.WriteLine— the Debug pane shows you everything, including nested object properties. - Configure
argsinlaunch.jsonfor command-line applications. - Attach to
dotnet watch runfor the best of both worlds: hot-reload and debugging. - Learn the toolbar shortcuts —
F5(continue),F10(step over),F11(step into) keep you in flow.
What’s Next
In Part 4: Productivity, we’ll cover the keyboard shortcuts and task configurations that make VS Code a productivity powerhouse for C# development.